CHAPTER 05 · DATA SCIENCE & ML

CHAPTER 05 · DATA SCIENCE & ML

05

05

05

Data science, self-taught.

Data science, self-taught.

Data science, self-taught.

I came to data from graphic design and learned it the way I learn anything: by building something real. These are the machine-learning and SQL projects that taught me, with most of the code on GitHub.

I came to data from graphic design and learned it the way I learn anything: by building something real. These are the machine-learning and SQL projects that taught me, with most of the code on GitHub.

I came to data from graphic design and learned it the way I learn anything: by building something real. These are the machine-learning and SQL projects that taught me, with most of the code on GitHub.

SELF-TAUGHT

SELF-TAUGHT

PYTHON · SQL

PYTHON · SQL

CODE ON GITHUB

CODE ON GITHUB

LEARNING

LEARNING

Self-taught

Self-taught

Self-taught

LANGUAGES

LANGUAGES

Python · SQL

Python · SQL

Python · SQL

TOOLS

TOOLS

TensorFlow · pandas · Jupyter · Colab · VS Code · MySQL

TensorFlow · pandas · Jupyter · Colab · VS Code · MySQL

TensorFlow · pandas · Jupyter · Colab · VS Code · MySQL

IN NUMBERS

IN NUMBERS

5

5

5

BARBELL EXERCISES

BARBELL EXERCISES

bench press, deadlift, overhead press, row and squat, plus rest

bench press, deadlift, overhead press, row and squat, plus rest

5

5

5

MODEL TYPES

MODEL TYPES

compared across several feature sets

compared across several feature sets

2024

2024

2024

BUILDING SINCE

BUILDING SINCE

Python and AI-assisted tools I actually use

Python and AI-assisted tools I actually use

01 / 04 · TOOLS

01 / 04 · TOOLS

Built in the open

Built in the open

Built in the open

I work in Python and SQL, in Jupyter, Google Colab and VS Code, and I publish my code on GitHub. That habit stuck. Since 2024 I’ve used Python and AI-assisted development to build tools I actually use, like a Financial Reporting Bot that turns Taiwan stock-market data into scheduled morning and closing reports.

I work in Python and SQL, in Jupyter, Google Colab and VS Code, and I publish my code on GitHub. That habit stuck. Since 2024 I’ve used Python and AI-assisted development to build tools I actually use, like a Financial Reporting Bot that turns Taiwan stock-market data into scheduled morning and closing reports.

I work in Python and SQL, in Jupyter, Google Colab and VS Code, and I publish my code on GitHub. That habit stuck. Since 2024 I’ve used Python and AI-assisted development to build tools I actually use, like a Financial Reporting Bot that turns Taiwan stock-market data into scheduled morning and closing reports.

✓

✓

✓

Python · SQL · Jupyter · Colab · VS Code

Python · SQL · Jupyter · Colab · VS Code

Financial Reporting Bot on GitHub ↗

Financial Reporting Bot on GitHub ↗

Collage of Peter’s GitHub profile with pinned machine-learning repositories, layered over SQL queries in MySQL Workbench

01 / 04

01 · GitHub profile over MySQL Workbench

01 · GitHub profile over MySQL Workbench

ENLARGE

ENLARGE
Raw wristband sensor readings: a table of accelerometer values, a pandas preview labelled by exercise, and accelerometer and gyroscope time-series plots

02 / 04

02 · Raw wristband sensor readings

02 · Raw wristband sensor readings

ENLARGE

ENLARGE

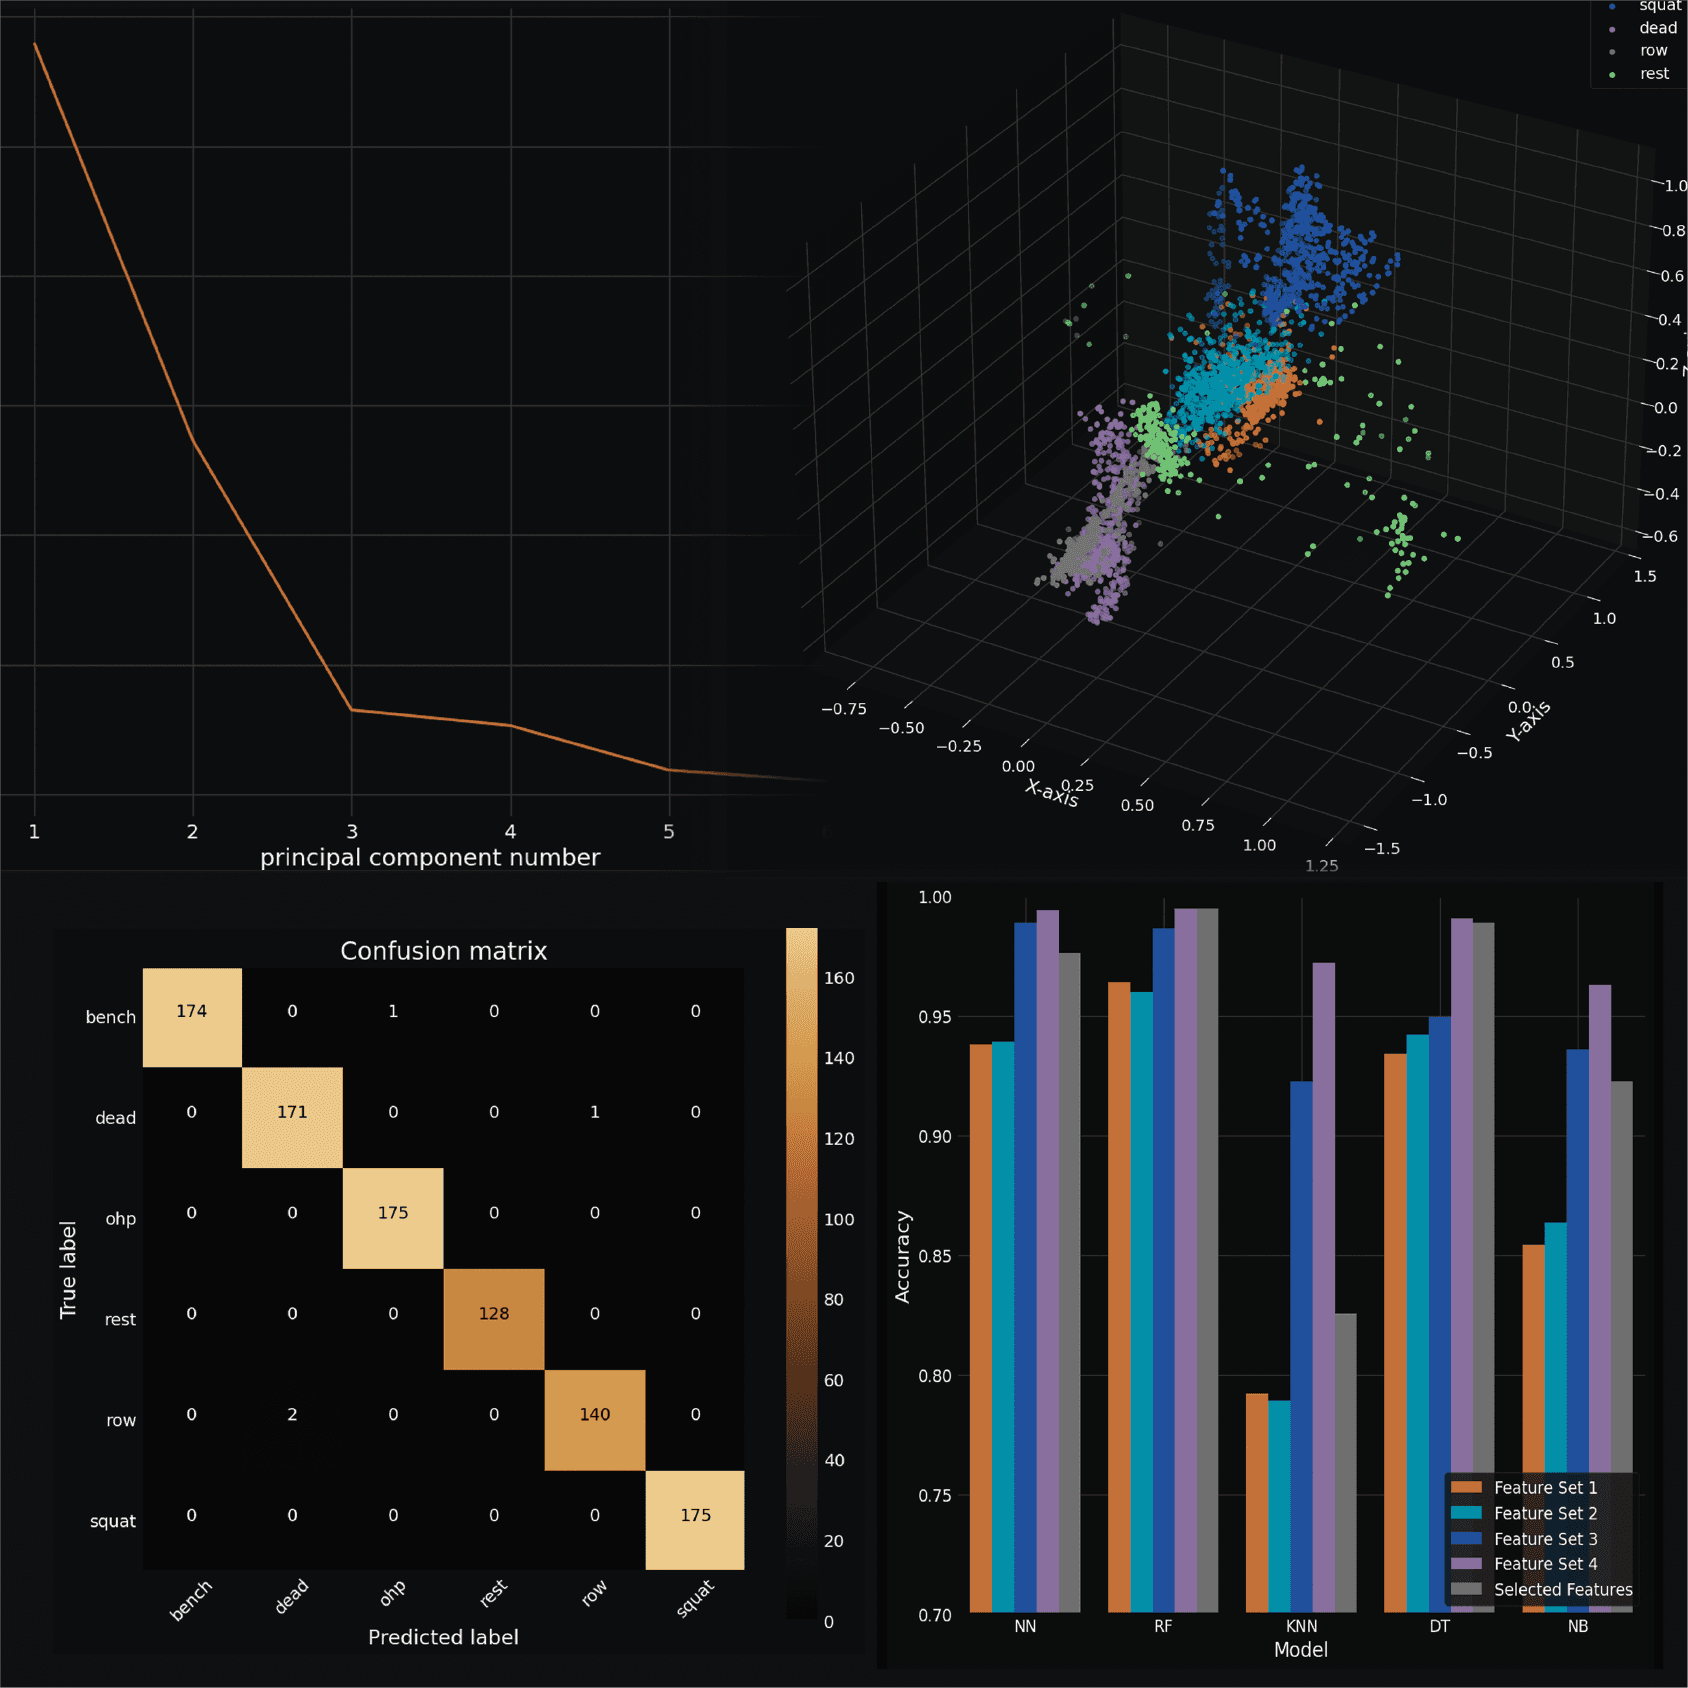
Model results for the barbell classifier: PCA elbow plot, 3D cluster of exercises, confusion matrix for bench, deadlift, overhead press, rest, row and squat, and accuracy by model and feature set

03 · PCA, clusters and confusion matrix

03 · PCA, clusters and confusion matrix

ENLARGE

ENLARGE

02 / 04 · WEARABLES

02 / 04 · WEARABLES

Wearable telemetry: which lift is it?

Wearable telemetry: which lift is it?

Wearable telemetry: which lift is it?

Can a wristband tell a squat from a deadlift? Using accelerometer and gyroscope data recorded from five lifters, I built a model that recognizes five barbell exercises (bench press, deadlift, overhead press, row and squat) plus the rest between sets. I cleaned the raw sensor logs in pandas, engineered features, explored them with PCA and clustering, then compared five model types across several feature sets.

Can a wristband tell a squat from a deadlift? Using accelerometer and gyroscope data recorded from five lifters, I built a model that recognizes five barbell exercises (bench press, deadlift, overhead press, row and squat) plus the rest between sets. I cleaned the raw sensor logs in pandas, engineered features, explored them with PCA and clustering, then compared five model types across several feature sets.

Can a wristband tell a squat from a deadlift? Using accelerometer and gyroscope data recorded from five lifters, I built a model that recognizes five barbell exercises (bench press, deadlift, overhead press, row and squat) plus the rest between sets. I cleaned the raw sensor logs in pandas, engineered features, explored them with PCA and clustering, then compared five model types across several feature sets.

✓

✓

✓

5 barbell lifts + rest between sets

5 barbell lifts + rest between sets

✓

✓

✓

5 model types compared

5 model types compared

View the repo ↗

View the repo ↗

“

“

“

FROM PART 03 · COMPUTER VISION

FROM PART 03 · COMPUTER VISION

A model is only as good as its data.

A model is only as good as its data.

A model is only as good as its data.

03 / 04 · COMPUTER VISION

03 / 04 · COMPUTER VISION

Computer vision: aircraft from above

Computer vision: aircraft from above

Computer vision: aircraft from above

This project taught me that a model is only as good as its data. I trained a TensorFlow object-detection model to find and label types of military aircraft in aerial images of airfields. Most of the work was the dataset: cleaning the XML annotation files, checking how the classes were distributed and giving every image the same aspect ratio, then tracking the loss curves in TensorBoard.

This project taught me that a model is only as good as its data. I trained a TensorFlow object-detection model to find and label types of military aircraft in aerial images of airfields. Most of the work was the dataset: cleaning the XML annotation files, checking how the classes were distributed and giving every image the same aspect ratio, then tracking the loss curves in TensorBoard.

This project taught me that a model is only as good as its data. I trained a TensorFlow object-detection model to find and label types of military aircraft in aerial images of airfields. Most of the work was the dataset: cleaning the XML annotation files, checking how the classes were distributed and giving every image the same aspect ratio, then tracking the loss curves in TensorBoard.

✓

✓

✓

TensorFlow object detection

TensorFlow object detection

✓

✓

✓

One aspect ratio for every image

One aspect ratio for every image

View the repo ↗

View the repo ↗

Aircraft detection dataset work: a Python script cleaning XML annotation files, a bar chart of aircraft class counts, and aerial airfield tiles with green boxes around parked aircraft

03 / 04

04 · Cleaning annotations; class counts

04 · Cleaning annotations; class counts

ENLARGE

ENLARGE

Google Colab notebook with TensorBoard loss curves falling over 40,000 training steps

05 · TensorBoard loss curves in Colab

05 · TensorBoard loss curves in Colab

ENLARGE

ENLARGE

LeetCode SQL 50 study plan and a solved MySQL problem, beside MySQL Workbench queries on a books table

04 / 04

06 · LeetCode SQL 50 and MySQL Workbench

06 · LeetCode SQL 50 and MySQL Workbench

ENLARGE

ENLARGE

04 / 04 · SQL

04 / 04 · SQL

Relational databases with SQL

Relational databases with SQL

Relational databases with SQL

My SQL comes from online courses and steady practice: LeetCode’s SQL 50 study plan, plus my own queries in MySQL Workbench. I focused on the fundamentals every analysis leans on: joins, subqueries, grouping and aggregation, indexing and transactions. Getting the right rows out, cleanly and quickly, comes before any chart or model.

My SQL comes from online courses and steady practice: LeetCode’s SQL 50 study plan, plus my own queries in MySQL Workbench. I focused on the fundamentals every analysis leans on: joins, subqueries, grouping and aggregation, indexing and transactions. Getting the right rows out, cleanly and quickly, comes before any chart or model.

My SQL comes from online courses and steady practice: LeetCode’s SQL 50 study plan, plus my own queries in MySQL Workbench. I focused on the fundamentals every analysis leans on: joins, subqueries, grouping and aggregation, indexing and transactions. Getting the right rows out, cleanly and quickly, comes before any chart or model.

✓

✓

✓

Joins, subqueries, grouping, indexing, transactions

Joins, subqueries, grouping, indexing, transactions

CONTACT

Let’s talk.

Let’s talk.

Let’s talk.

Open to security operations and safety roles, and always up for a good conversation about any of the six chapters.

Open to security operations and safety roles, and always up for a good conversation about any of the six chapters.

© 2026 PETER W. PAN · BEAR ON WATCH